- HOME
- Investor Relations
- Financial Data
- Performance Highlights
| Consolidated | FY2026/3(results) | |
|---|---|---|
| Net Sales | 319,385 | 1.1% |
| Operating Income | 25,156 | 2.4% |
| Ordinary Income | 25,666 | (1.6%) |
| Profit Atributable to Owners of Parent | 17,374 | 20.0% |
% is Year on Year
Performance overview for the fiscal year ended March 31, 2026
During the current consolidated fiscal year, the global economy followed a moderate recovery trajectory. Although tariff policies implemented by the United States caused significant disruption to the economies of various countries, personal consumption and capital investment remained firm, supported by economic stimulus measures taken by governments worldwide. Meanwhile, in Japan, despite continued rising prices particularly for food products, the economy showed a gradual recovery, driven by a rebound in personal consumption due to improvements in employment and income conditions.
Segment overview for the fiscal year ended March 31, 2026
| Printing and Industrial Materials Products (Year on Year) | |
|---|---|
| Net Sales |
¥182,644
million (down 1.1%)
|
| Operating Income |
¥1,979
million (down 63.8%) |


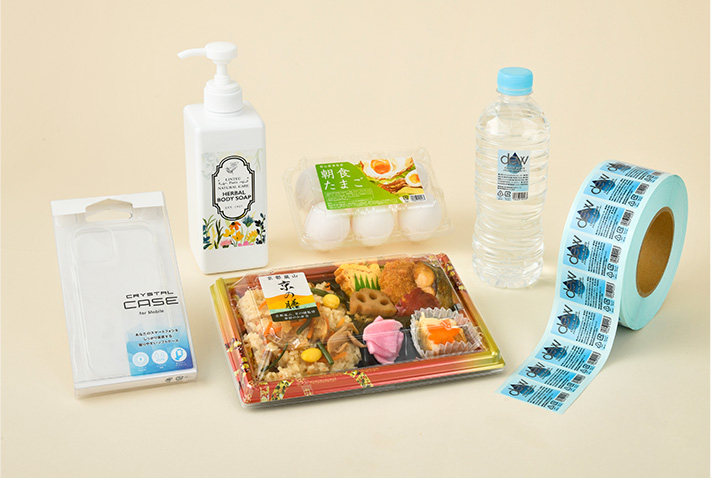
| Printing & Variable Infomation Products Operations (Year on Year) | |
|---|---|
| Net Sales |
¥145,517
million (down 0.8%) |
As for adhesive products for seals and labels, in Japan, although demand, especially that related to food products and beverage campaigns, was sluggish, sales of products for medical and logistics applications remained solid, and demand for eye-catching labels recovered. Outside Japan, the United States saw an increase in sales volumes, but overall sales declined due mainly to changes in the sales mix and the impact of foreign exchange rates. In addition, demand remained sluggish in the ASEAN region.
| Industrial & Material Operations | |
|---|---|
| Net Sales |
¥37,126
million (down 2.3%) |
Japan saw a sluggish in sales of window films for building-use, but sales of automobile-use window films and adhesive products remained solid. Overseas, demand for security window films declined in the United States, and sales of automobile-use adhesive products decreased in the ASEAN region.

Segment operating income
Operating income was 1,979 million yen (down 63.8% year-on-year), due to the rising prices of fuel and raw materials, and cost of logistics, as well as the impact of an increase in fixed costs in Japan, and also the impact of an increase in fixed costs and a deterioration in process yields in the United States.
| Electronic and Optical Products (Year on Year) | |
|---|---|
| Net Sales |
¥100,726
million (up 4.6%) |
| Operating Income |
¥22,120
million (up 19.5%) |


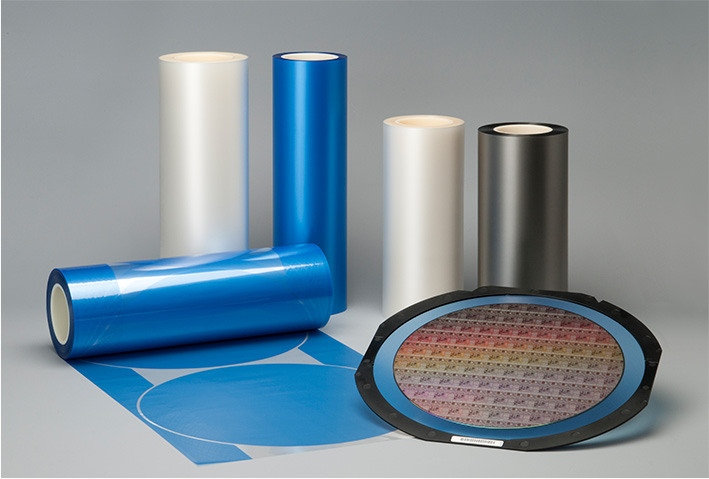
| Advanced Materials Operations (Year on Year) | |
|---|---|
| Net Sales |
¥92,809
million (up 9.2%) |
Although sales of semiconductor-related devices saw a slight decrease, semiconductor-related adhesive tapes continued to perform well due to reasons such as increased demand related to AI. Sales of multilayer ceramic capacitor-related tape were also strong, driven by increased demand for high-end products for data centers and smartphones.
| Optical Products Operations (Year on Year) | |
|---|---|
| Net Sales |
¥7,916
million (down 30.0%) |
Although sales of adhesive tapes for OLED displays were almost on par with the previous year, overall sales declined due to the impact from the closure of subsidiaries in South Korea and Taiwan.

Segment operating income
Despite increased fixed costs such as depreciation for newly enhanced production capacity, operating income was 22,120 million yen (up 19.5% year-on-year), due to an increase in sales volumes of semiconductor and electronic component-related products.
| Paper and Converted Products (Year on Year) | |
|---|---|
| Net Sales |
¥36,014
million (up 2.8%) |
| Operating Income |
¥977
million (up 82.6%) |


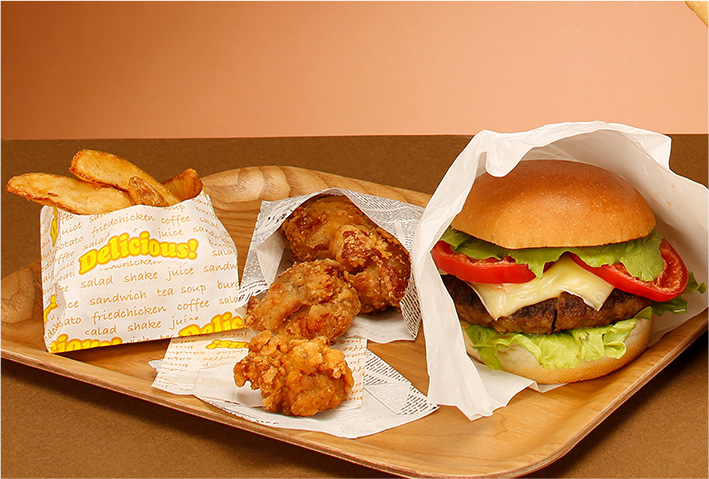
| Fine & Speciality Paper Products Operations (Year on Year) | |
|---|---|
| Net Sales |
¥14,677
million (down 1.3%) |
Despite solid sales of industrial speciality papers, sales of core products like color papers for envelopes, and oil- and water-resistant papers were sluggish due to lower demand.
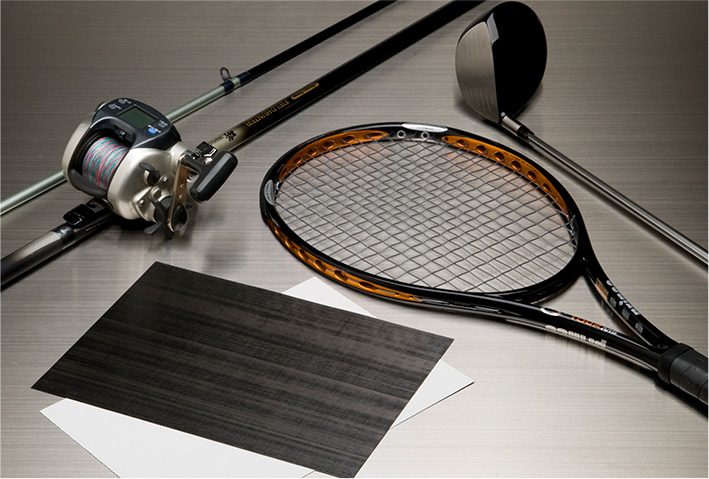
| Converted Products Operations (Year on Year) | |
|---|---|
| Net Sales |
¥21,336
million (up 5.9%) |
Despite a decrease in sales of casting papers for synthetic leather, sales of release papers, especially for electronic materials, remained solid. In addition, demand recovered for release films for optical-related products and casting papers for carbon fiber composite materials.
Segment operating income
Despite the impact of rising prices of fuel and raw materials, and cost of logistics, operating income was 977 million yen (up 82.6% year-on-year), due to the decrease in operating loss by the previously recorded impairment losses on non-current assets pertaining to the Fine & Specialty Paper Products Operations and the increase in sales volumes in Converted Products Operations.
Forecasts of consolidated business results for the fiscal year ending March 31, 2027
| Consolidated | FY2027/3(forecasts) | |
|---|---|---|
| Net Sales | 342,000 | 7.1% |
| Operating Income | 27,500 | 9.3% |
| Ordinary Income | 27,500 | 7.1% |
| Profit Atributable to Owners of Parent | 19,500 | 12.2% |
% is Year on Year