annual_2016
47/76
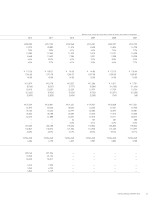
Millions of yen, except per share data, number of shares, and number of employees 201220112010200920082007¥200,905 ¥212,733 ¥189,348 ¥194,901¥202,297¥192,72313,975 20,889 11,576 8,49814,89414,7987.0%9.8%6.1%4.4%7.4%7.7%13,382 19,565 11,399 5,21513,19114,2988,648 13,622 7,284 3,3919,30810,2386.6%10.9%6.2%2.9%8.0%9.5%6.5%9.7%6.1%3.0%6.6%7.7%¥ 115.26 ¥ 180.21 ¥ 96.36 ¥ 44.86¥ 123.15¥ 135.441,766.60 1,715.78 1,596.37 1,497.581,598.301,489.8740.00 40.00 24.00 20.0024.0018.00¥ 10,079 ¥10,178 ¥10,537 ¥11,286¥ 9,011¥ 7,701(8,760)(8,237)(7,777)(9,584)(14,700)(11,646)18,910 23,307 22,259 12,97917,73913,734(12,262)(9,926)(9,253)(9,752)(15,071)(12,200)(5,099)(2,820)(3,454)(2,300)(769)(68)¥137,229 ¥132,891 ¥121,451 ¥ 95,937¥120,028¥117,53162,075 60,465 58,654 43,65567,63167,95075,153 72,426 62,797 52,28252,39749,58136,036 35,188 25,387 15,37017,31515,55062,273 61,888 63,337 67,01073,71168,377——54 107201280——0.0%0.1%0.2%0.3%210,203 206,188 195,656 172,854204,852198,526132,847 130,576 121,502 113,930121,635113,39762.8%62.9%61.7%65.5%59.4%57.1%76,564,240 76,564,240 76,564,240 76,564,24076,564,24076,564,2404,286 4,198 4,037 3,9873,8023,708¥90,143 ¥91,936 ————73,925 81,193 ————53,225 55,317 ————5,213 7,990 ————3,942 6,732 ————4,846 6,129 ————45LINTEC ANNUAL REPORT 2016
元のページ